第十届中国国际机器视觉展暨机器视觉技术及工业应用研讨会
The 10th China International Machine Vision Exhibition
and Machine Vision Technology & Application Conference
2013 年10 月16-18 日 October 16 to 18, 2013
北京. 中国国际展览中心(老馆) China International Exhibition Center, Beijing
展会报告
SHOW REPORT
2013-11
展会综合信息
General Information
主办单位 Sponsors:
中国图象图形学学会
China Society of Image and Graphics (CSIG)
中国国际展览中心集团公司
China International Exhibition Center Group Corp. (CIEC)
协办单位Supporters:
中国光学光电子行业协会
China Optics and Optoelectronics Manufactures Association (COEMA)
上海图象图形学学会
Shanghai Society of Image and Graphics
天津图象图形学学会
Tianjin Society of Image and Graphics
陕西图象图形学学会
Shanxi Society of Image and Graphics
广东图象图形学学会
Guangdong Society of Image and Graphics
承办单位Organizers:
中国图象图形学学会机器视觉专业委员会
Machine Vision Professional Committee under CSIG
中展集团北京华港展览有限公司
CIEC Exhibition Co., Ltd.
海外支持Overseas Supporters:
美国自动化成像协会(AIA)
欧洲机器视觉协会(EMVA)
日本工业成像协会(JIIA)
新加坡工业自动化协会(SIAA)
观众数据分析
Data Analysis
一、 观众地区构成分析 Regions analysis
1. 观众人数统计分析By quantity of visitors
为期三天的展会共吸引了来自国内25个省、市、自治区、香港、台湾地区以及美国、韩国、日本、新加坡、加拿大、英国、德国、俄罗斯等国家的16,520名参观者(含同期光电展观众),参观者拥有地域上的广泛性、行业上的代表性以及知识上的专业性。
The three-day exhibition has attracted 16,520 trade visitors from China, Hong Kong, Taiwan, the United States, Korea, Japan, Singapore, Canada, Britain, Germany and Russia etc. (including the visitors of ILOPE)
|
地区 Region
|
样本数 Amount of Visitors
|
|
内地China
|
15910
|
|
台湾Taiwan
|
100
|
|
澳门Macao
|
0
|
|
香港Hong Kong
|
40
|
|
海外Overseas
|
470
|
|
合计Total
|
16520
|
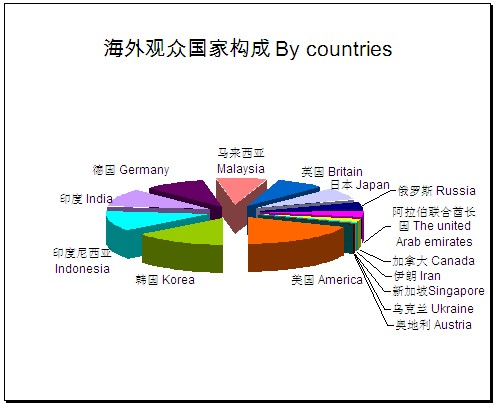
2. 海外地区分布 By countries
|
序号
No.
|
国别
Country
|
样本数
Amount of Visitors
|
占比%
% in Total Space
|
|
1
|
美国 America
|
87
|
18.51%
|
|
2
|
韩国 Korea
|
69
|
14.68%
|
|
3
|
印度尼西亚 Indonesia
|
55
|
11.70%
|
|
4
|
印度 India
|
53
|
11.28%
|
|
5
|
德国 Germany
|
44
|
9.36%
|
|
6
|
马来西亚 Malaysia
|
38
|
8.09%
|
|
7
|
英国 Britain
|
35
|
7.45%
|
|
8
|
日本 Japan
|
35
|
7.45%
|
|
9
|
俄罗斯 Russia
|
21
|
4.47%
|
|
10
|
阿拉伯联合酋长国 The united Arab emirates
|
17
|
3.62%
|
|
11
|
加拿大 Canada
|
10
|
2.13%
|
|
12
|
伊朗 Iran
|
3
|
0.64%
|
|
13
|
新加坡 Singapore
|
1
|
0.21%
|
|
14
|
乌克兰 Ukraine
|
1
|
0.21%
|
|
15
|
奥地利 Austria
|
1
|
0.21%
|
|
合计 Total
|
|
470
|
|
3. 地区省份构成 By region in China
|
序号
No.
|
省份/直辖市
Region
|
样本数
Amount of Visitors
|
占比%
% in Total Space
|
|
1
|
北京 Beijing
|
10965
|
68.92%
|
|
2
|
天津 Taijin
|
956
|
6.01%
|
|
3
|
河北 Hebei
|
714
|
4.49%
|
|
4
|
山东 Shandong
|
495
|
3.11%
|
|
5
|
上海 Shanghai
|
423
|
2.66%
|
|
6
|
广东 Guangdong
|
418
|
2.63%
|
|
7
|
江苏 Jiangsu
|
380
|
2.39%
|
|
8
|
辽宁 Liaoning
|
264
|
1.66%
|
|
9
|
浙江 Zhejiang
|
231
|
1.45%
|
|
10
|
河南 Henan
|
208
|
1.31%
|
|
11
|
陕西 Shaanxi
|
131
|
0.82%
|
|
12
|
湖北 Hubei
|
127
|
0.80%
|
|
13
|
吉林 Jilin
|
99
|
0.62%
|
|
14
|
安徽 Anhui
|
88
|
0.55%
|
|
15
|
福建 Fujian
|
75
|
0.47%
|
|
16
|
四川 Sichuan
|
72
|
0.45%
|
|
17
|
湖南 Hunan
|
65
|
0.41%
|
|
18
|
黑龙江 Heilongjiang
|
63
|
0.40%
|
|
19
|
内蒙古 Neimenggu
|
56
|
0.35%
|
|
20
|
山西 Shanxi
|
42
|
0.26%
|
|
21
|
重庆 Chongqing
|
16
|
0.10%
|
|
22
|
新疆 Xinjiang
|
11
|
0.07%
|
|
23
|
云南 Yunnan
|
5
|
0.03%
|
|
24
|
江西 Jiangxi
|
4
|
0.03%
|
|
25
|
宁夏 Ningxia
|
2
|
0.01%
|
|
合计 Total
|
|
15910
|
|
二、调研项的分析Visitor survey analysis
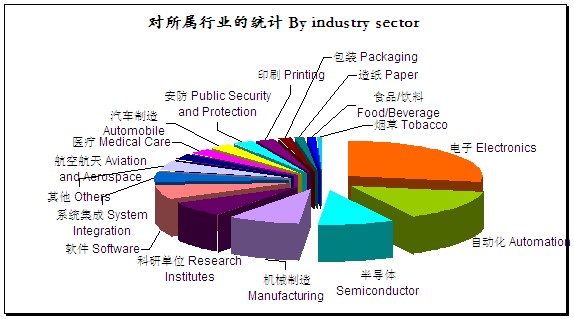
1. 对所属行业的统计 By industry sector
|
序号
No.
|
所属行业
Industry Sector
|
占比%
% in Total Space
|
序号
No.
|
所属行业
Industry Sector
|
占比%
% in Total Space
|
|
1
|
电子
Electronics
|
27.76%
|
10
|
医疗
Medical Care
|
2.71%
|
|
2
|
自动化
Automation
|
14.43%
|
11
|
汽车制造
Automobile
|
2.65%
|
|
3
|
半导体
Semiconductor
|
9.14%
|
12
|
安防
Public Security and Protection
|
2.55%
|
|
4
|
机械制造
Manufacturing
|
8.60%
|
13
|
印刷
Printing
|
2.02%
|
|
5
|
科研单位
Research Institutes
|
7.37%
|
14
|
包装
Packaging
|
1.89%
|
|
6
|
软件
Software
|
6.65%
|
15
|
造纸
Paper
|
1.13%
|
|
7
|
系统集成
System Integration
|
4.41%
|
16
|
食品/饮料
Food/Beverage
|
1.10%
|
|
8
|
其他
Others
|
4.35%
|
17
|
烟草
Tobacco
|
0.44%
|
|
9
|
航空航天
Aviation and Aerospace
|
2.80%
|
|
|
|
2. 对感兴趣的产品的统计 By interested products
|
序号
No.
|
感兴趣产品
Interested Products
|
占比%
% in Total Space
|
|
1
|
智能相机Smart Camera
|
21.05%
|
|
2
|
图像处理系统Image Processing System
|
17.29%
|
|
3
|
机器视觉集成Machine Vision System
|
13.56%
|
|
4
|
工业镜头Industrial Lens
|
12.94%
|
|
5
|
光 源Light Source
|
11.68%
|
|
6
|
板 卡Board
|
7.35%
|
|
7
|
软件包Software Package
|
7.01%
|
|
8
|
配 件Accessories
|
4.21%
|
|
9
|
辅助产品Subsidiary products
|
2.89%
|
|
10
|
其他others
|
2.02%
|
3. 对参观目的的统计 By purpose of visit
|
序号
No.
|
参观展会的目的
Purpose of your visit
|
占比%
% in Total Space
|
|
1
|
了解新产品和技术
Learning the newest information on technology and products
|
26.35%
|
|
2
|
寻求合作机会Looking for business opportunity
|
24.98%
|
|
3
|
收集市场信息Collecting Market Information
|
19.78%
|
|
4
|
采购Purchasing
|
18.44%
|
|
5
|
考察、评估展览会Evaluating the exhibition
|
5.94%
|
|
6
|
推销本公司产品Selling
|
3.05%
|
|
7
|
其他Others
|
1.46%
|
4. 对通过何种途径了解此展会的统计How do visitors get to know about Vision China
|
序号
No.
|
通过何种途径了解我们的展会
Where did you know about Vision China 2012
|
占比%
% in Total Space
|
|
1
|
网站Websites
|
37.95%
|
|
2
|
专业杂志Magazines
|
19.28%
|
|
3
|
参展商邀请Invitations from exhibitors
|
12.91%
|
|
4
|
主办单位寄发展会资料Invitations from the organizers
|
12.34%
|
|
5
|
大众报纸、广播General newspaper, broadcast
|
6.13%
|
|
6
|
相关行业协会邀请Invitations from related associations
|
4.40%
|
|
7
|
参观其它展览会Visiting other exhibitions
|
3.95%
|
|
8
|
其他Others
|
3.04%
|
点击下载: Vision China 2013 展后报告.zip